When developing Java applications that run on Kubernetes, one of our key tasks before we head to production is testing our app in high loads of data and validating its ability to scale. It is only then that we often find memory leaks or configurations that were not properly tuned which could lead to excessive memory consumption and finally crash our app.
One way to avoid out-of-memory issues is by configuring metrics and alerts that will tell us the story of our app overtime and notify us when something bad may be happening - before it reaches the customer. Knowing which metrics to monitor can be tricky given the many possibilities and specifically for memory usage there are some factors we need to be familiar with before we get started.
For developers who use the Spring Boot project, which provides us with an easier and faster way to set up our application, one of the valuable features in this framework is a module called Actuator, which comes out-of-the-box with a number of HTTP endpoints that reveal internal information of a running application. This includes endpoints such as /health to get the current status of the app, /env to get all the properties of the app, and more.
Another valuable endpoint supplied to us using Actuator is /metrics. We can use this endpoint to return important metrics of the current application: memory information, threads status, GC information and so on.
Some of the important metrics related to memory usage that are exposed:
- "jvm.memory.max" - the max heap/non heap size the application can occupy
- "jvm.memory.used" - the amount of memory that is currently occupied by Java objects
- "jvm.memory.committed" - the amount of memory guaranteed to be available for use by JVM
- "jvm.buffer.memory.used - temporary buffer cache
These metrics are supplied using Micrometer, specifically by Micrometer’s JvmMemory class. As we can see in the source code, this information comes from java using java.lang.management.ManagementFactory class.
|
curl http://localhost:9092/actuator/metrics/jvm.memory.used | jq
{
"name": "jvm.memory.used",
"description": "The amount of used memory",
"baseUnit": "bytes",
"measurements": [
{
"statistic": "VALUE",
"value": 252847776
}
],
"availableTags": [
{
"tag": "area",
"values": [
"heap",
"nonheap"
]
}
]
}
|
Kubectl Top
When we run our application in a Kubernetes cluster, more specifically in a pod, the convention is to run a single java process in one pod. That allows easier scaling and decoupling between the services. When the pod is running, we can then use the ‘kubectl top’ command which is available through the Metrics API to reveal information such as container CPU and memory usage in bytes.
These metrics can be accessed either with the kubectl top command, or by a controller in the cluster, for example Horizontal Pod Autoscaler, to make decisions on what to do when a container passes a specified threshold.
NOTE: The API requires the metrics server to be deployed in the cluster. Otherwise it will not be available.
|
kubectl top pod kim-mem-d9b549f78-qcqcb -n kim-mem
NAME CPU(cores) MEMORY(bytes)
kim-mem-d9b549f78-qcqcb 4m 654Mi
|
The value shown by the kubectl top command is collected using cAdvisor. The basic flow of how cAdvisor retrieves memory information is as follows:
- If we exec our container and navigate to the following dir:
- We should see the following files:
|
/sys/fs/cgroup/memory # ls
cgroup.clone_children memory.kmem.max_usage_in_bytes memory.limit_in_bytes memory.numa_stat memory.use_hierarchy
cgroup.event_control memory.kmem.slabinfo memory.max_usage_in_bytes memory.oom_control notify_on_release
cgroup.procs memory.kmem.tcp.failcnt memory.memsw.failcnt memory.pressure_level tasks
memory.failcnt memory.kmem.tcp.limit_in_bytes memory.memsw.limit_in_bytes memory.soft_limit_in_bytes
memory.force_empty memory.kmem.tcp.max_usage_in_bytes memory.memsw.max_usage_in_bytes memory.stat
memory.kmem.failcnt memory.kmem.tcp.usage_in_bytes memory.memsw.usage_in_bytes memory.swappiness
memory.kmem.limit_in_bytes memory.kmem.usage_in_bytes memory.move_charge_at_immigrate memory.usage_in_bytes
|
- Each file contains a piece of information about the memory. The relevant information is in the memory.status file:
|
/sys/fs/cgroup/memory # cat memory.stat
cache 675840
rss 673292288
rss_huge 0
shmem 0
mapped_file 270336
dirty 270336
writeback 0
swap 0
pgpgin 391149
pgpgout 226585
pgfault 483615
pgmajfault 1320
inactive_anon 0
active_anon 673406976
inactive_file 0
active_file 73728
unevictable 0
hierarchical_memory_limit 1499996160
hierarchical_memsw_limit 1499996160
total_cache 675840
total_rss 673292288
total_rss_huge 0
total_shmem 0
total_mapped_file 270336
total_dirty 270336
total_writeback 0
total_swap 0
total_pgpgin 391149
total_pgpgout 226585
total_pgfault 483615
total_pgmajfault 1320
total_inactive_anon 0
total_active_anon 673406976
total_inactive_file 0
total_active_file 73728
total_unevictable 0
|
The cAdvisor gathers those numbers and uses them to calculate different memory metrics which are collected by Prometheus. See here a list of metrics collected by cAdvisor.
The kubectl top command specifically uses the container_memory_working_set_bytes metric:
Working Set Memory
The amount of Working Set memory includes recently accessed memory, dirty memory, and kernel memory. Working Set equals ‘memory used - total_inactive_file’, see the code here.
The Working Set is the current size, in bytes, of the Working Set of this process. They are a set of memory pages touched recently by the threads in the process. So ‘Working Set memory’ is an estimate of how much memory cannot be evicted.
According to Kubernetes official doc: In an ideal world, the "Working Set" is the amount of memory in-use that cannot be freed under memory pressure. However, calculation of the working set varies by host OS, and generally makes heavy use of heuristics to produce an estimate.
It includes all anonymous (non-file-backed) memory since Kubernetes does not support swap. The metric typically also includes some cached (file-backed) memory, because the host OS cannot always reclaim such pages.
Let's have a look at an application metrics which tracks both the actuator /metrics endpoint and kubectl top:
- JVM total metric (heap/nonheap) - AVG 478MB:
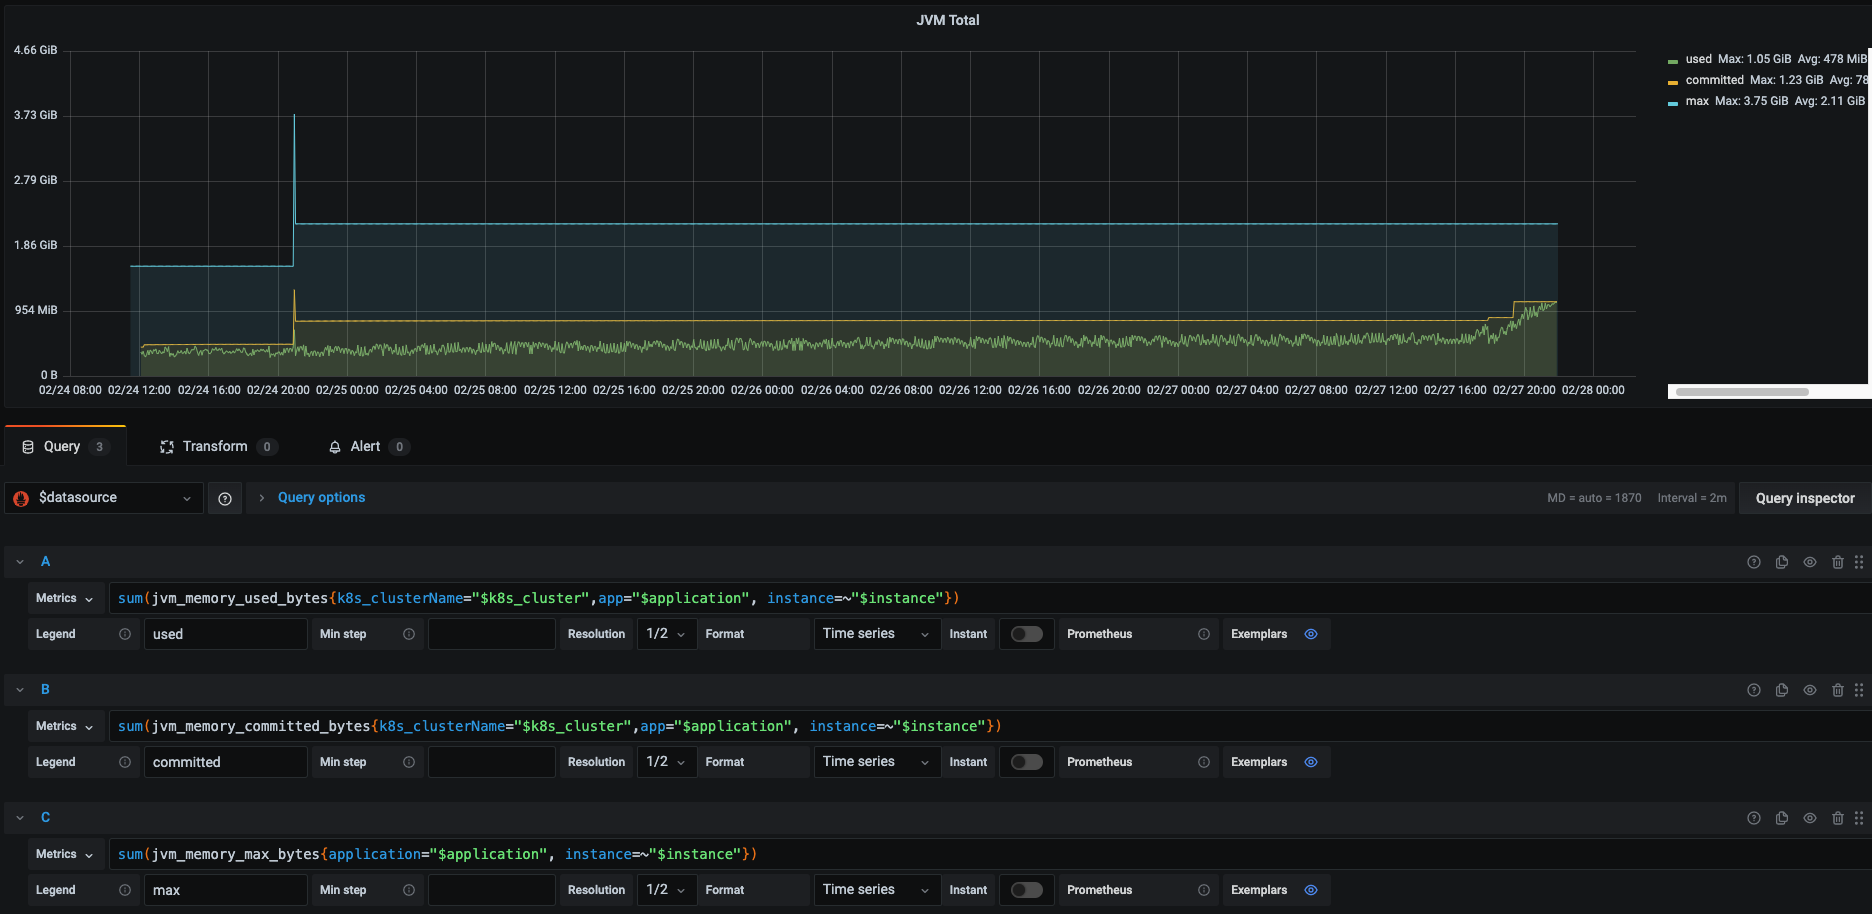
This metric which uses Spring’s jvm.memory.used alongside the committed and max usage allowed reveal that our heap + our nonheap memory used an average of 478MB overtime and show a spike of usage in the last day.
- Kubectl top metric - AVG 862MB:
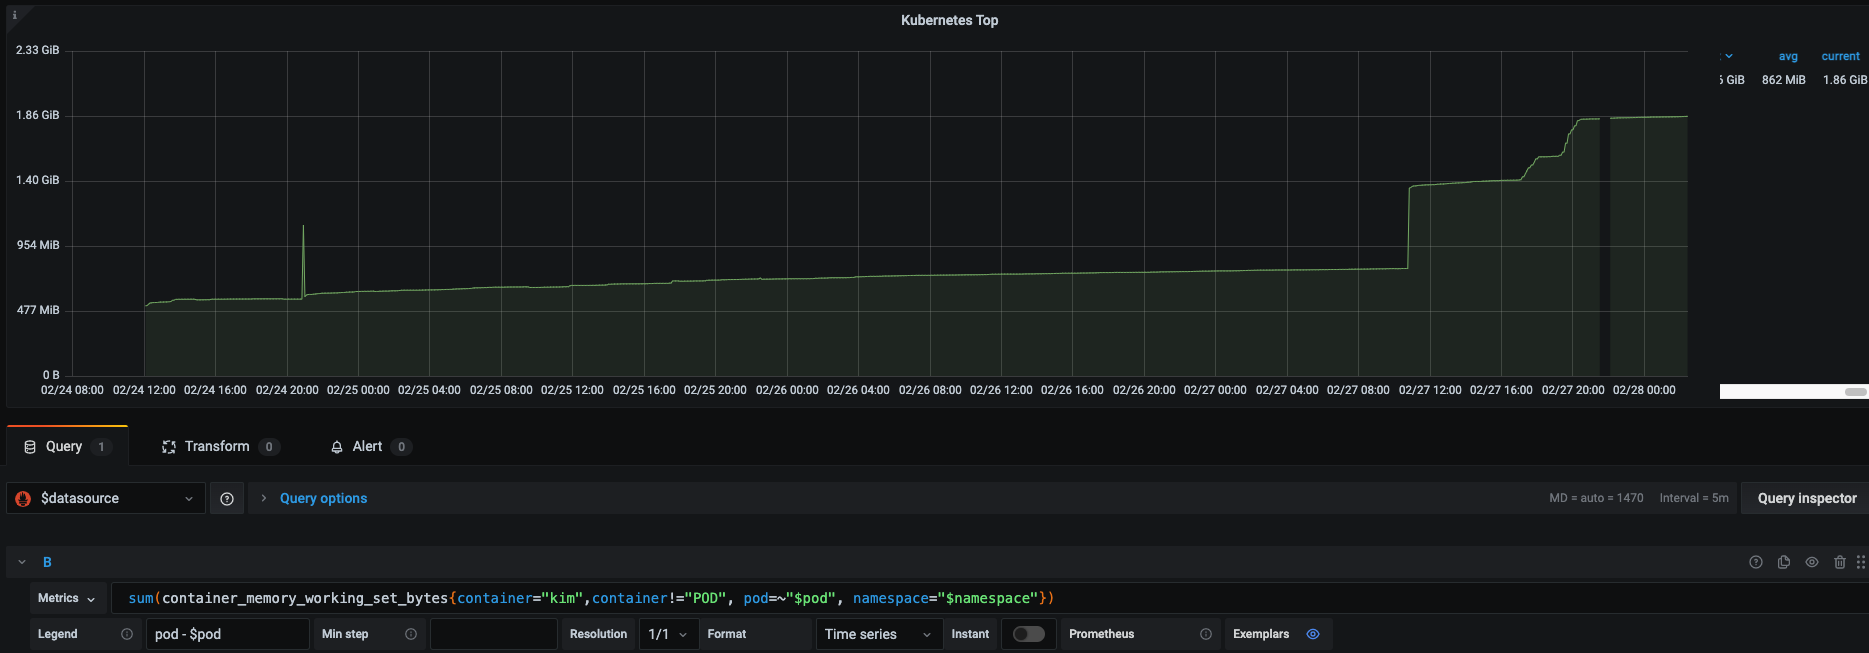
However, the kubectl’s Working Set memory metric reveals a significant difference of roughly 400MB (mostly due to OS space).
Out-Of-Memory (OOM)
The infamous Out Of Memory (OOM) error is a common case in JVM. When forgetting to properly set the -Xms and -Xmx parameters to define a suitable size to our heap, the OOM can easily be reached given the default heap size might be only 25% (depending on your java version and total size).
However, defining JVM params when running in a pod is not enough. We should also use Kubernetes resource limits in a relative way to let our app grow in spikes and rush hours.
Kubernetes resource limits provides us the ability to request an initial size to our pod, and also set a limit which will be the max memory and CPU this pod is allowed to grow (limits are not a promise - they will be supplied only if the node has enough resources, only the requests is a promise).
As a rule of thumb, since the limits are not a promise, it's good practice to assign the minimum heap space (-Xms) as equal to the maximum heap space allowed (-Xmx). This will ensure the estimated usage we need for our heap will be available. A pod which will hit the max size specified in it’s deployment, will encounter (yet again) OOM and crash our pod. This can happen even if our heap space has not been maxed yet!
Given the above, when configuring our dashboard it’s recommended to monitor both of the above metrics (JVM space and Kubernetes top), and set a reasonable threshold that will notify us when either JVM space is running out or the overall memory of the application is not as expected. If we find the spike on time, we can either add additional replicas of our pod until the load decreases or at least have spare time to investigate the source of the load and release a fix.